How To Obtain Proper Exposure
Using Histograms
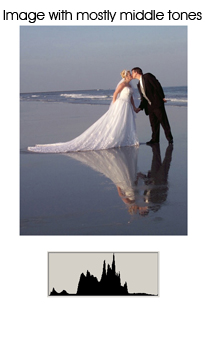
Histograms convey basic information about the brightness of an image.
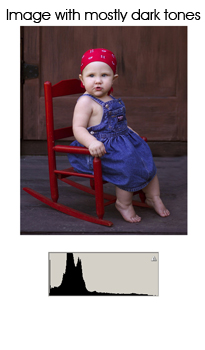
When the tones in an image are darker, the histogram will show more data to the left.
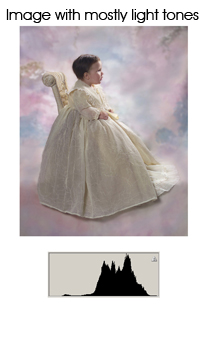
When the tones in an image are lighter, the histogram will show more data to the right.
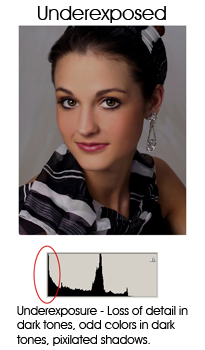
When the histogram shows data at the far left end, it indicates that there will be no detail in the dark portion of an image. This generally indicates the image is underexposed.
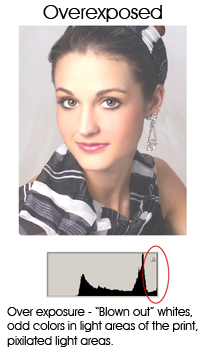
When the histogram shows data at the far right end, it indicates that there will be no detail in the lighter portion of an image. This generally indicates the image is overexposed.
Evaluating Exposure using Histograms
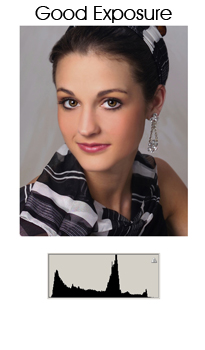
Here are some well-exposed images with their histograms.
These histograms illustrate problems with exposure.